Transform research summaries into speaking infographics with CapCut PC
Many students, researchers, and professionals find it hard to explain their work in a way that others can follow. Long reports and heavy slides often lose people’s interest. That’s why turning research into short, clear visuals can make a big difference.
One smart way to do this is by using speaking infographics. These are short videos that show key points with images, charts, and voice. Instead of reading a long document, the viewer gets the main idea in seconds.
The good news? You don’t need any video skills to create one. CapCut Desktop Video Editor gives you tools to turn your research into a clean, clear video with voice built in. It's quick and simple. Let’s see why this tool is useful for your next research video.
Benefits of Speaking Infographics in Research Presentation
Sharing research can be hard when the content is full of numbers and long terms. People lose focus when the format is plain. But when you mix visuals with voice, things become easy to follow.
Speaking infographics let you show data and explain it at the same time. This makes it easy for the viewer to follow each point. Charts, images, and keywords guide the eye. A clear voice helps the listener understand what they see.
With CapCut Desktop Video Editor, you can pair your visuals with a voice in a few steps. It has a built-in AI voice generator that makes your script sound smooth and clear. You don’t need to speak or record anything yourself.
Just keep in mind, some features, like top voice styles or extra effects, may need a paid plan on CapCut PC. This new way to present makes your work easier to watch, easier to share, and easier to remember.
Why Use CapCut PC for Speaking Infographics?
When it comes to turning research into videos, you need a tool that does more than just cut and trim. CapCut Desktop Video Editor is made for that. It helps you build speaking infographics from start to finish.
Its timeline lets you line up each part of your content. You can easily move slides, text, and photos into place. Then, you can add shapes, labels, and titles using ready-made templates. This changes simple facts into engaging visuals.
You can also use motion tools to bring life to static data. These effects help the viewer stay focused. To improve the appearance of your video, you can apply smart filters and video polish tools. This works like an AI video upscaler, giving your content a sharper and cleaner look.
The built-in voice tool changes your script into a voice that fits your tone. This AI Text-to-Speech tool helps you make a clear message without speaking.
CapCut PC does not place watermarks on the final video, even if you use many clips. While it is free to download, some extra tools, like top voice styles or graphic effects, need a paid plan.
Step-by-Step: Create a Speaking Infographic Using CapCut PC
Step 1: Download and Install CapCut PC
Go to the official CapCut website. Click the download button to get the setup file for CapCut Desktop Video Editor. Once downloaded, open the file and follow the steps on screen to install it.
After that, sign up using your email. Signing up is free and takes just a few minutes. Now you're ready to start your project.

Step 2: Import and Organize Research Visuals
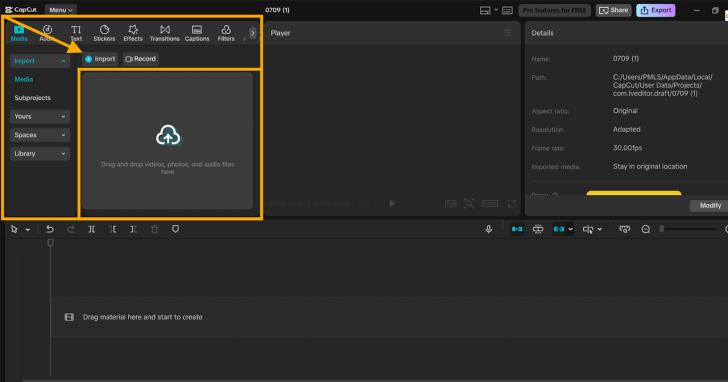
Open CapCut PC and click “Import” on the left side. Select your research visuals like charts, slides, or photos from your computer. After uploading, place them on the timeline at the bottom of the screen.
Reorder them as needed to match the flow of your summary. This keeps your message clear and simple to follow.
Step 3: Add TTS Narration
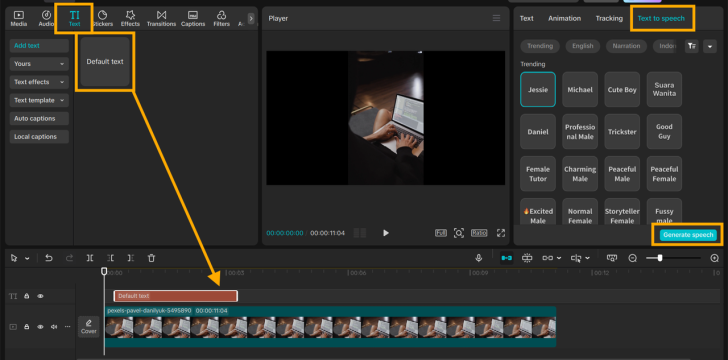
Click on the "Text" tab from the top menu. Select "Default text" and drag it to your timeline. A text box will appear. Click inside it and paste your summary.
Now, with the text layer selected, look to the right-side menu and click on "Text to speech". Choose your voice, pitch, and language. Then click "Generate speech".
The tool will turn your text into a voice clip using text to speech AI. Drag this clip to the audio track under your visuals. Your narration is now synced with your video.
Step 4: Add Motion and Design Elements
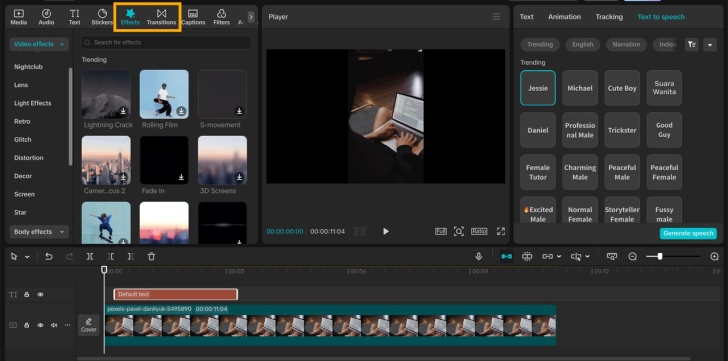
Click on “Effects” or “Stickers” to add icons or highlights. Use “Animations” to bring movement to your slides. These small touches help keep the viewer focused.
Step 5: Export and Share
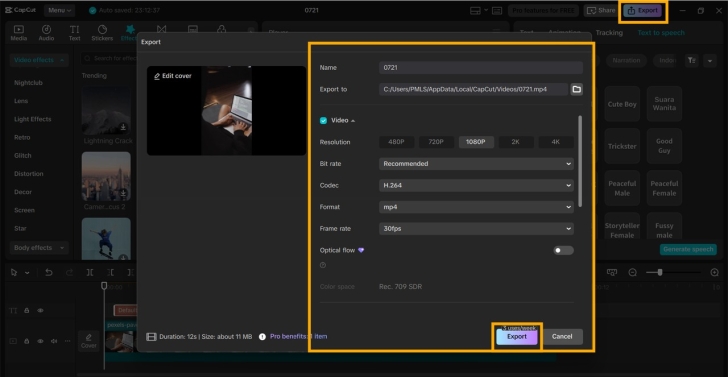
Click “Export” in the top right corner. Choose your settings like resolution and file type. Then hit “Export” again to save your video. Now you can share it on YouTube, post it on LinkedIn, or send it to your class.
Conclusion
Turning research into speaking infographics is a smart way to make your work easy to understand. It helps people follow their ideas and remember them better.
With CapCut Desktop Video Editor, you can do it all in one place, add visuals, create voiceovers, and build a full story from your summary.
The software is free to download from the official site. But some tools, like special voices and extra effects, may need a paid plan.
If you have research to share, try making your first speaking infographic with CapCut PC today. It’s a clear and simple way to bring your message to life, whether in class, at work, or online.